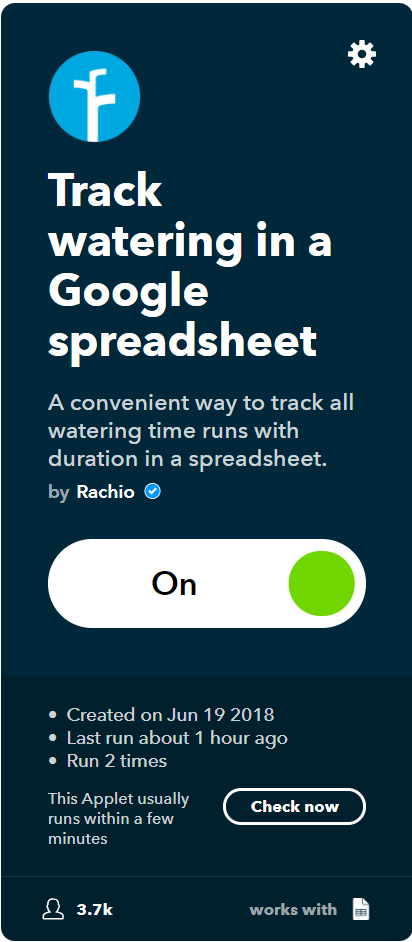
Now that I have my flow meter installed I decided to turn on the IFTTT applet that creates a usage spreadsheet. It is still reporting time, although my Rachio app. shows gallons. Is there an option to have it report gallons ?
@azdavidr It looks like it is quite a bit of work. Adding one field to that trigger requires a re-submittal of the entire IFTTT application. I’ll put this feature request in our product backlog.

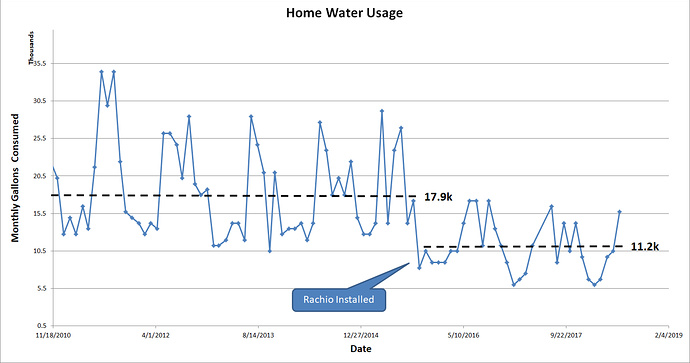
Bummer. Is that kind of data available somewhere in the app? I’d really like to see trend charts to see how my usage changes, per zone, across seasons and even years. I’m definitely a data geek, so this next one might just be me. I’d even be interested to see how the flow changes during a run so I can see how long it takes my system to pressurize, and it would help me to feel more comfortable about the number to use for a leak detection on my 4 hour drip runs!
1 Like

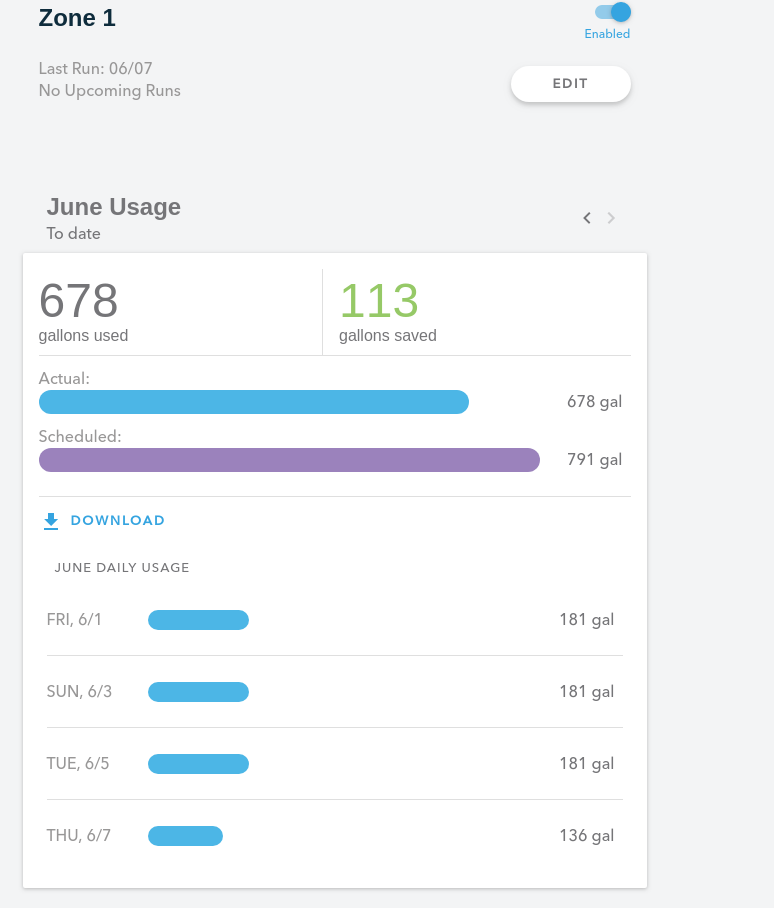
The data is there, but getting it aggregated onto a trend chart is what I’m looking for. I’d basically like to recreate this for each zone.
It would give me an idea of how seasonal changes (monsoon season, brutal heat, mild winter) impact my usage. I would also be able to see the longer term, aggregate impact of zone setting changes.
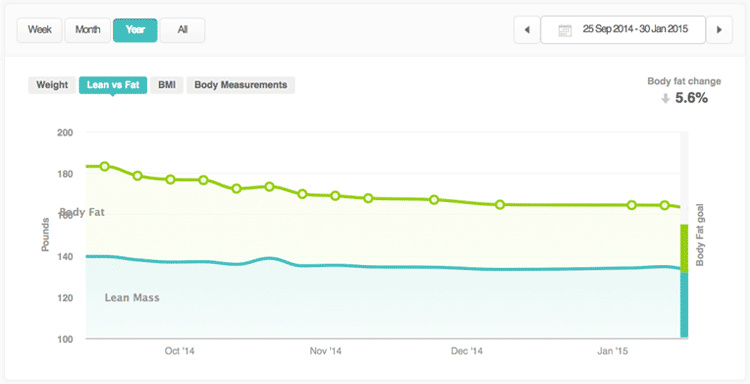
I could take the usage numbers that you show in the sample screenshot and put them into a spreadsheet, but that’s a manual, time intensive process. Even dumping a CSV file would be helpful, but having it in the app with the ability to export CSV would be ideal. These are examples from the Fitbit app. that I found online that capture the intent. This first image shows how you could plot the water usage over various periods of time:
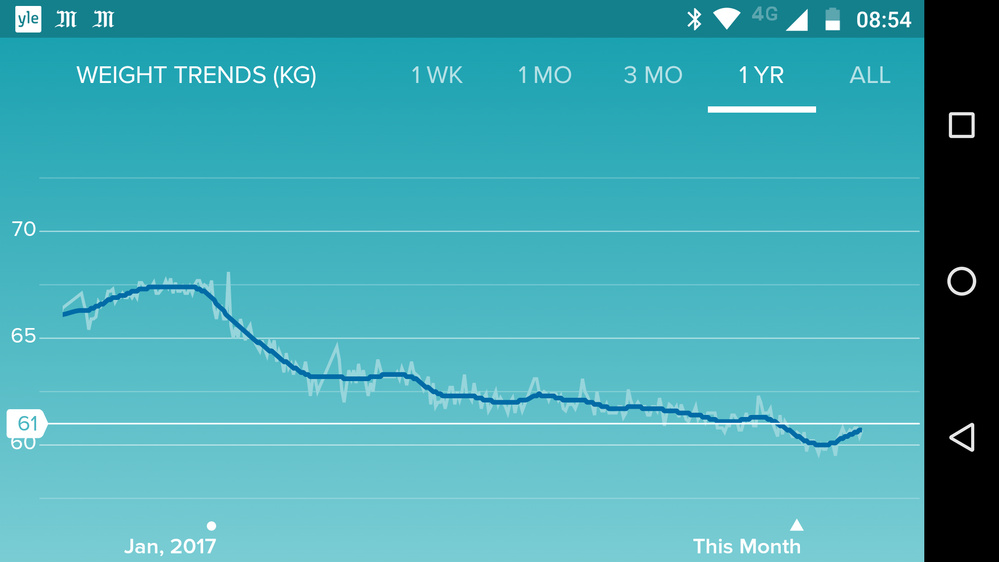
Even better, this one would be a cool way to overlay usage for all zones with each individual zone, and also control the time period that you would like to see (Instead of ‘Weight’ the button would read ‘ALL ZONES’, instead of ‘Lean vs Fat’ it might read ‘Trees’, etc.
The data is there, I just think there’s a ton of value in seeing the trend over time!
5 Likes
Yeah this is great, will try to think how we uncover more of this and make it accessible.
2 Likes